Open Configuration > System Settings > Usage to see how much your organisation used the system each month: the devices, integrations and API keys you had, the messages sent on your behalf, and the activity behind them such as check-ins, registrations and approvals. The page shows counts only, never prices, and only your own organisation’s figures.
Before you start: you need System Settings access. Anyone who can open System Settings can open this page.
The figures are collected as the system runs and are updated about every 15 minutes. History is kept for 400 days.
Step 1: Choose the month
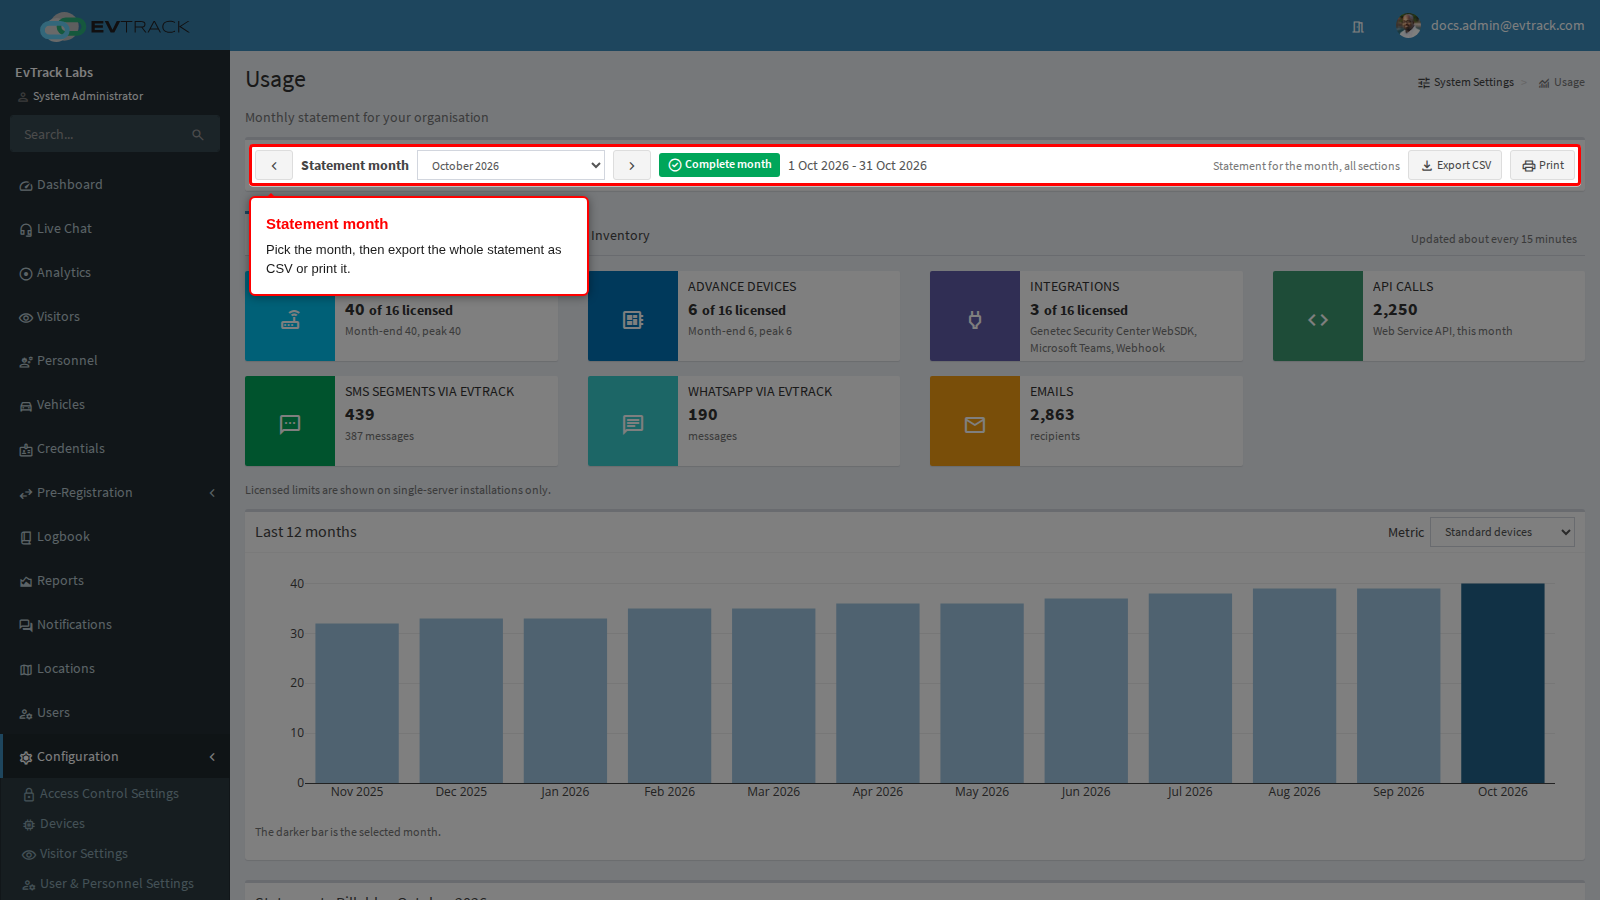
The bar at the top picks the Statement month: use the arrows or the list, which covers the current month and the twelve before it. The current month is marked In progress - updated about every 15 minutes; any earlier month is a Complete month. Export CSV downloads the whole month’s statement, every section, as one file, and Print prints the section you are looking at.
Step 2: Pick a section
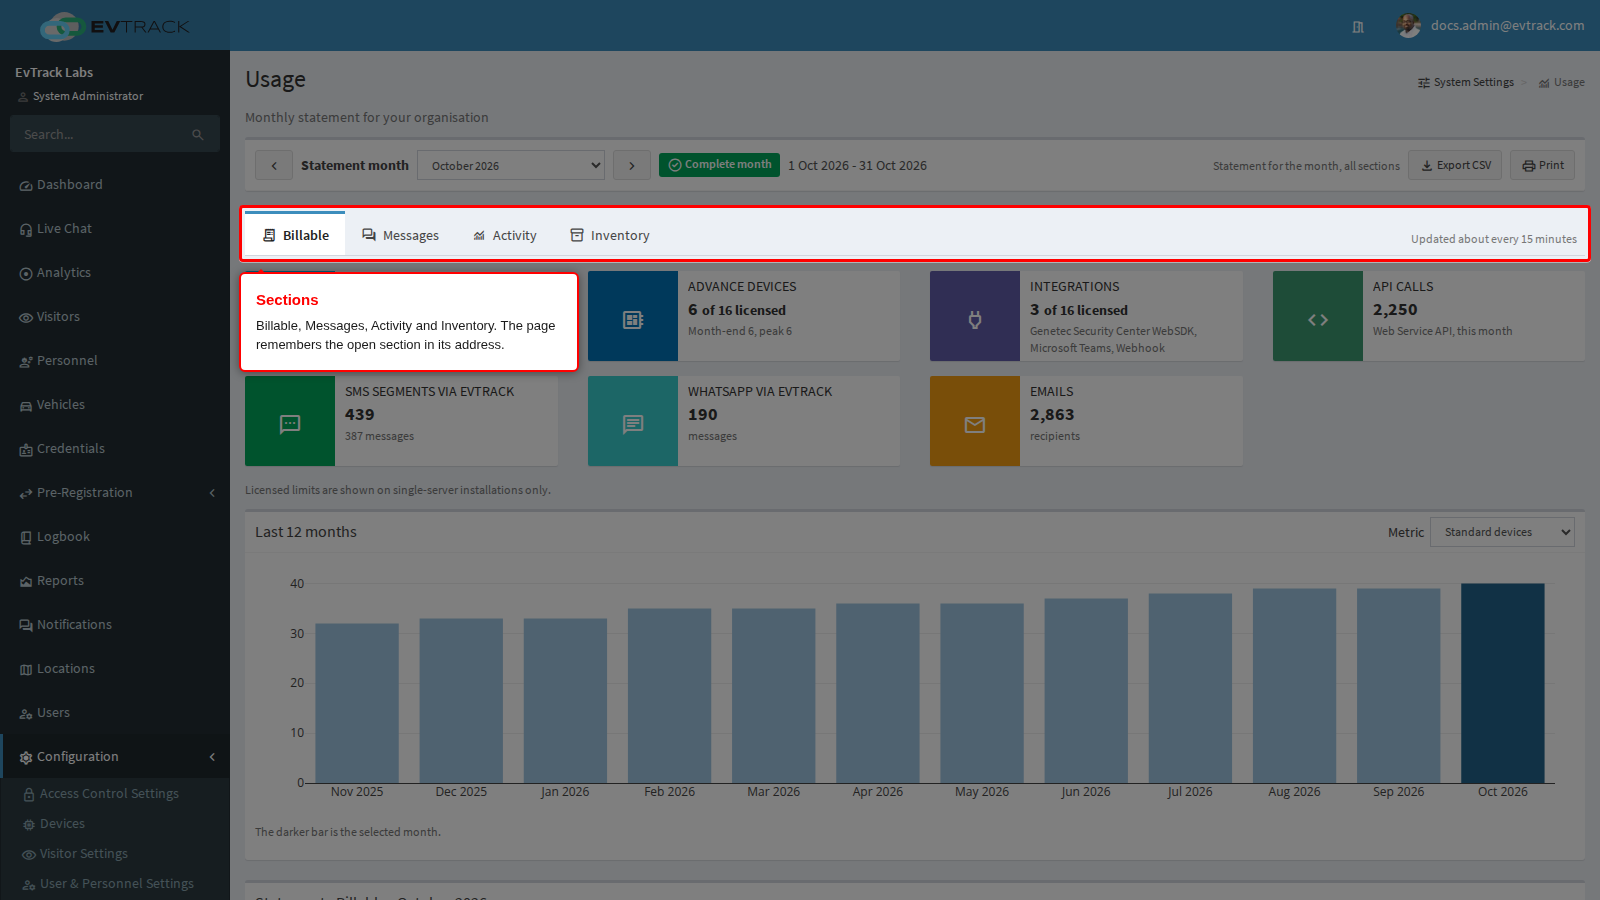
The page is split into four sections. The section you open is kept in the page address, so a bookmark or a shared link opens the same section.
- Billable - what you may be billed for: devices, integrations, API keys, Web Service API calls, SMS and WhatsApp messages sent via EvTrack, and emails.
- Messages - SMS, WhatsApp and email.
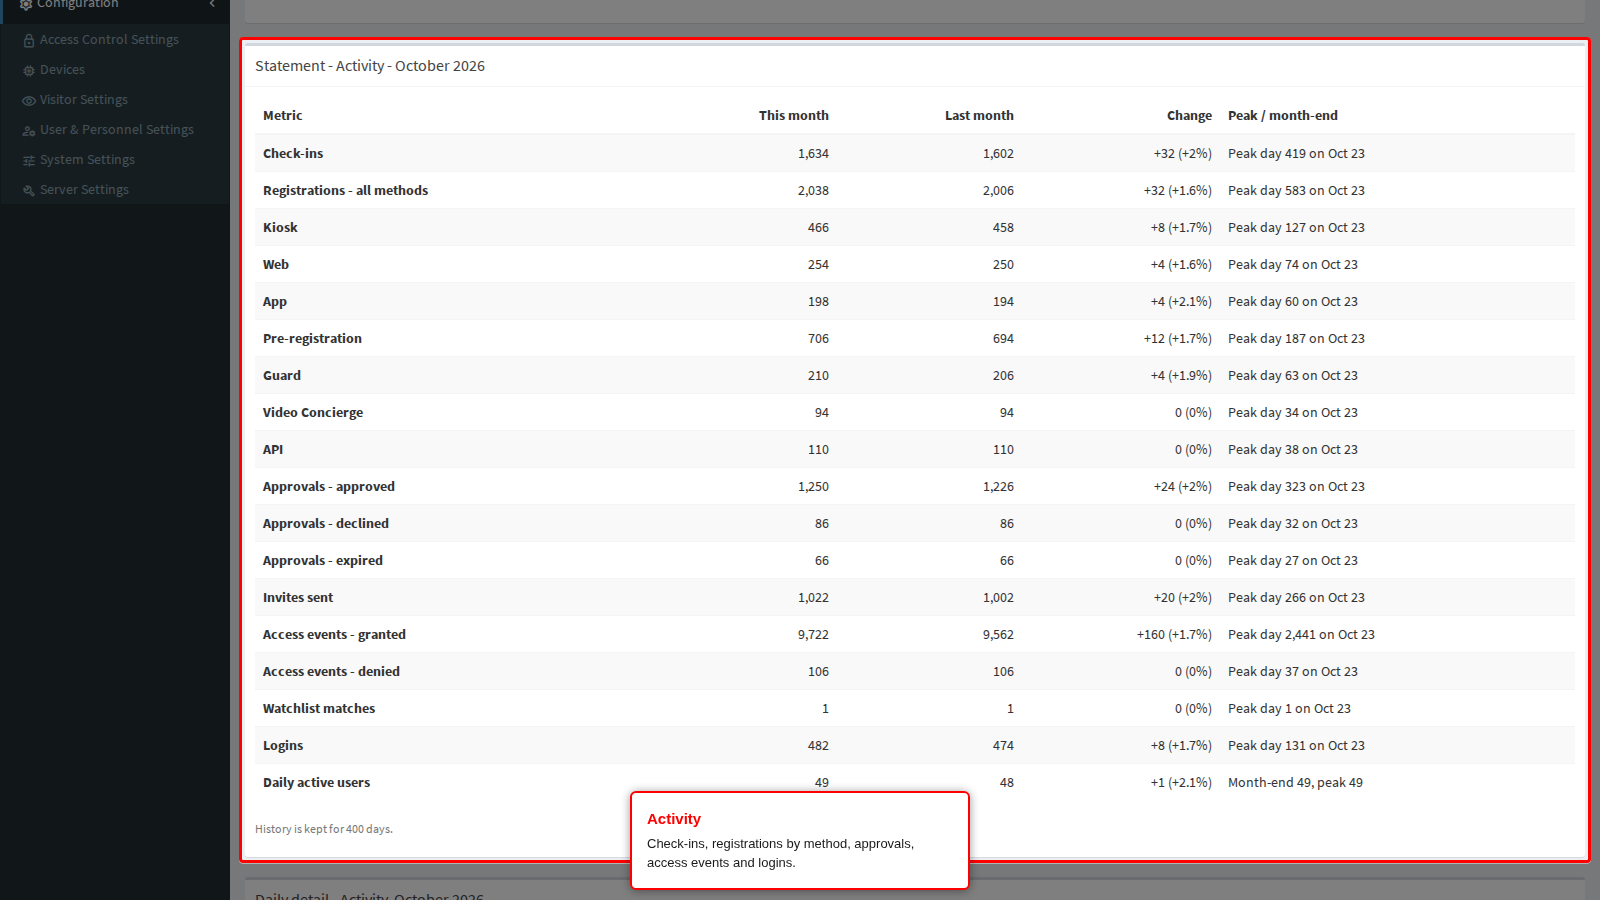
- Activity - whether the system is being used: check-ins, registrations, approvals, invites, access events, watchlist matches and logins.
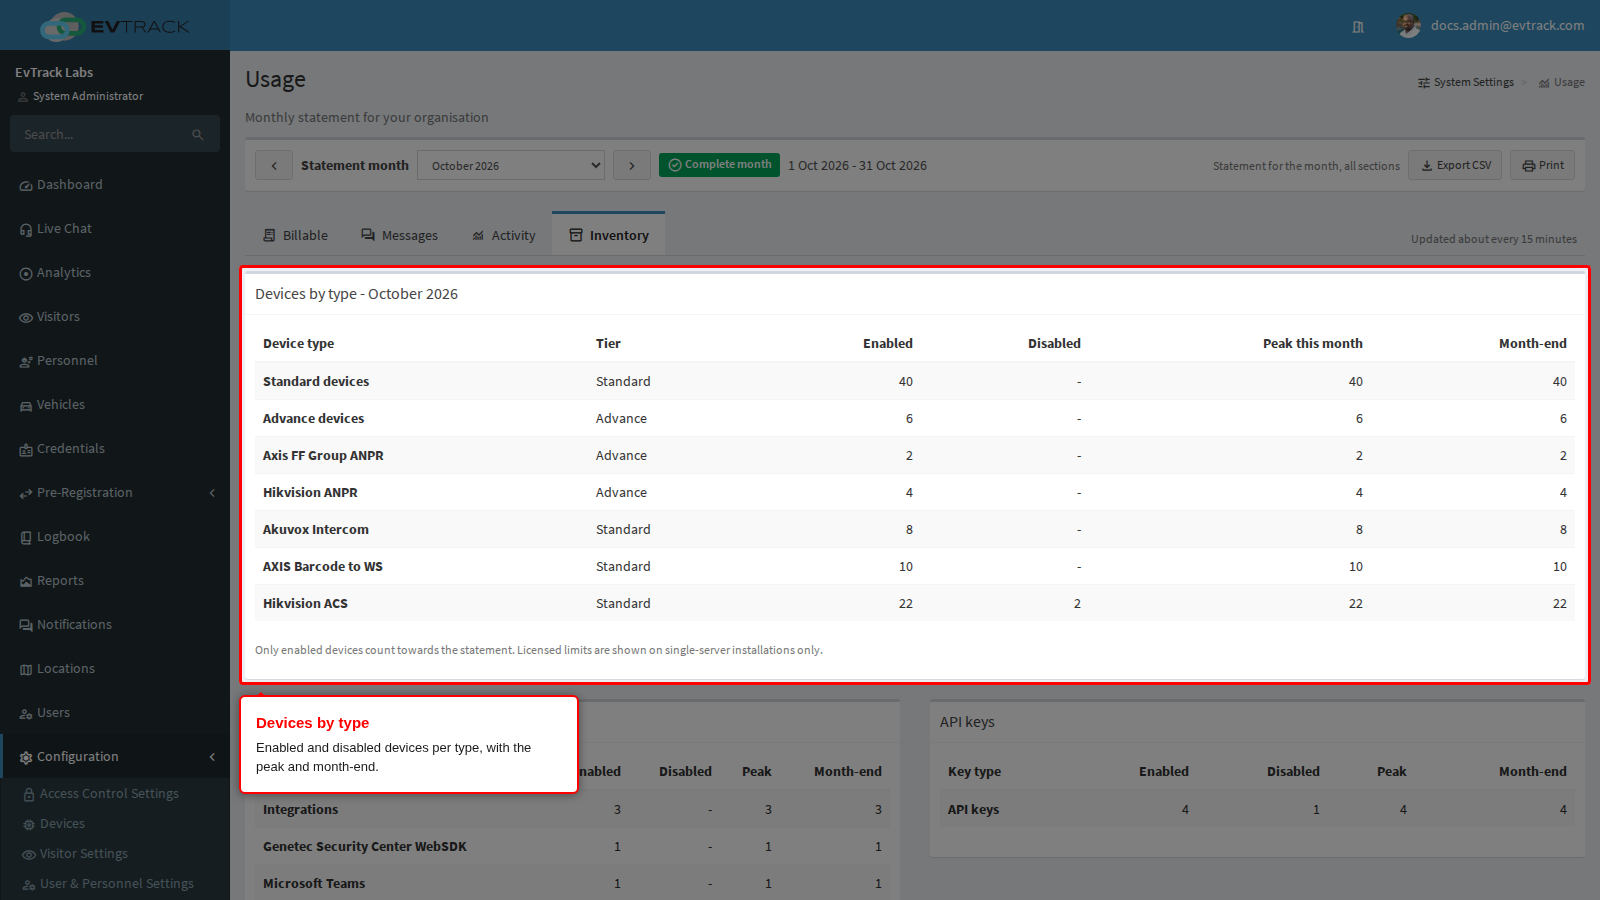
- Inventory - devices, integrations and API keys by type.
Billable
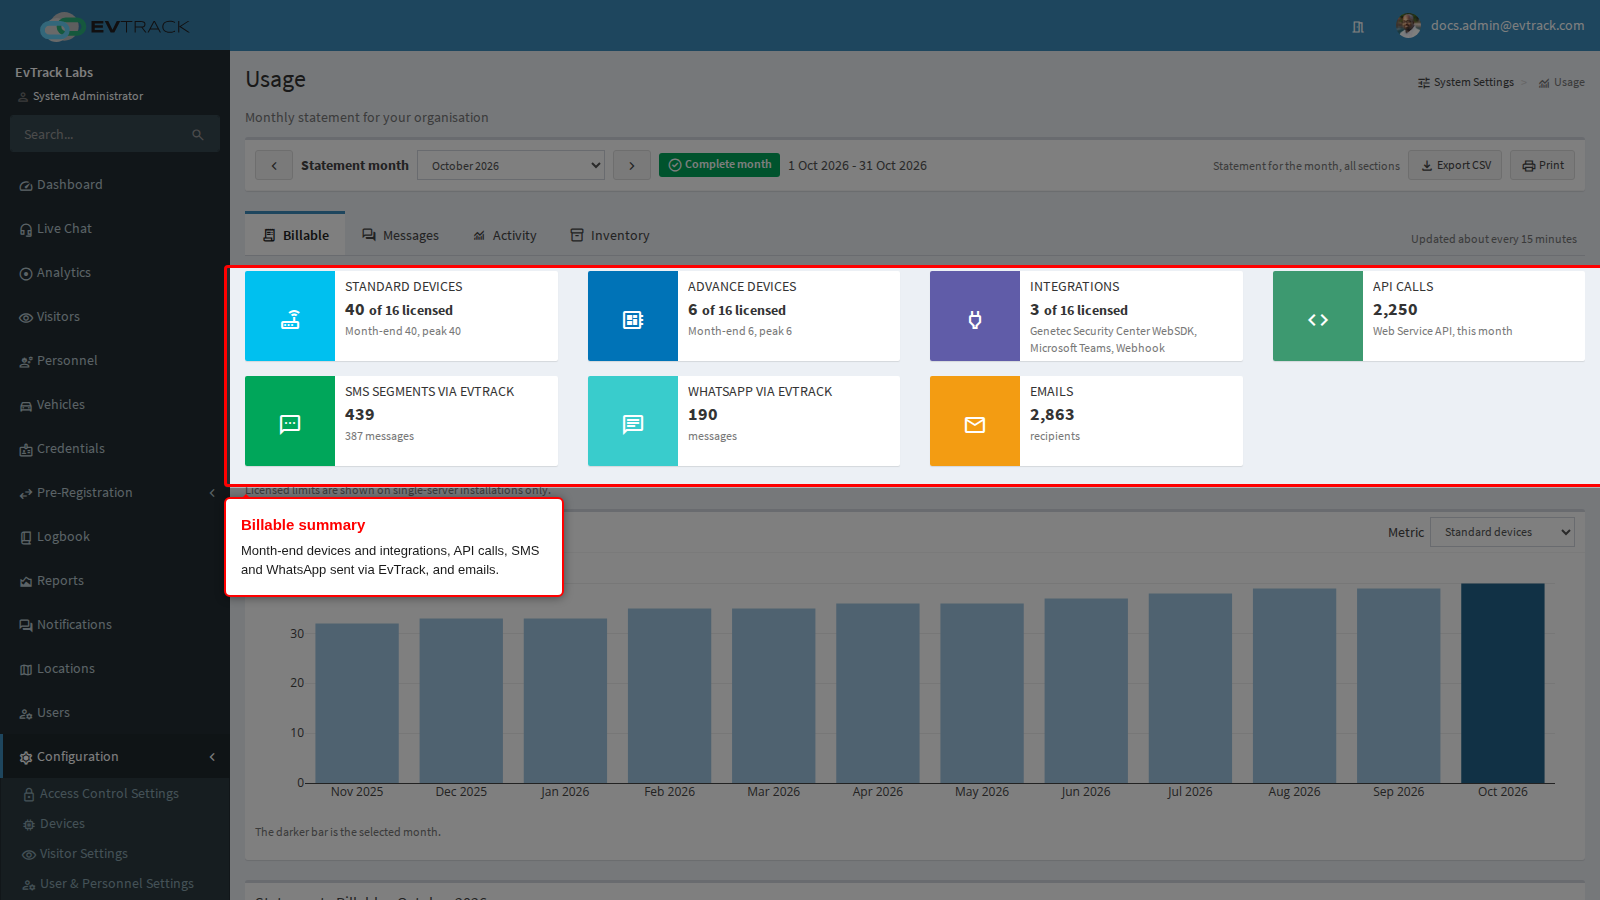
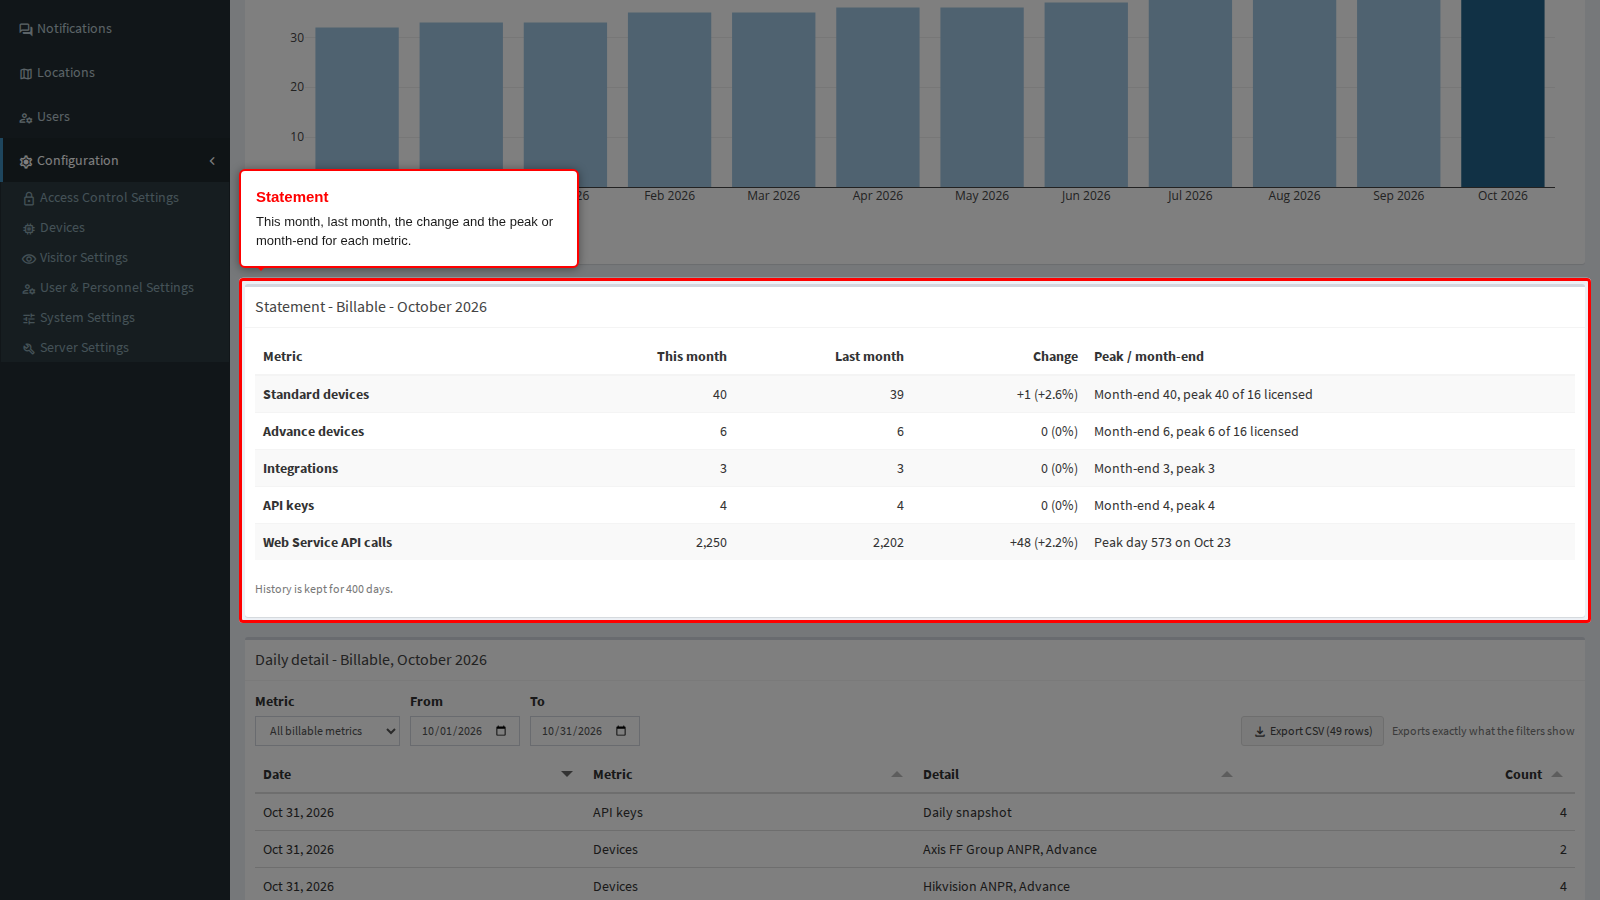
The summary boxes show the month-end number of standard and advance devices (with the month’s peak) and of integrations, the Web Service API calls made in the month, the SMS segments and WhatsApp messages sent via EvTrack, and the emails sent (counted per recipient). On a single-server installation each device and integration box also shows your licensed limit, for example 12 of 16 licensed. Licensed limits are shown on single-server installations only.
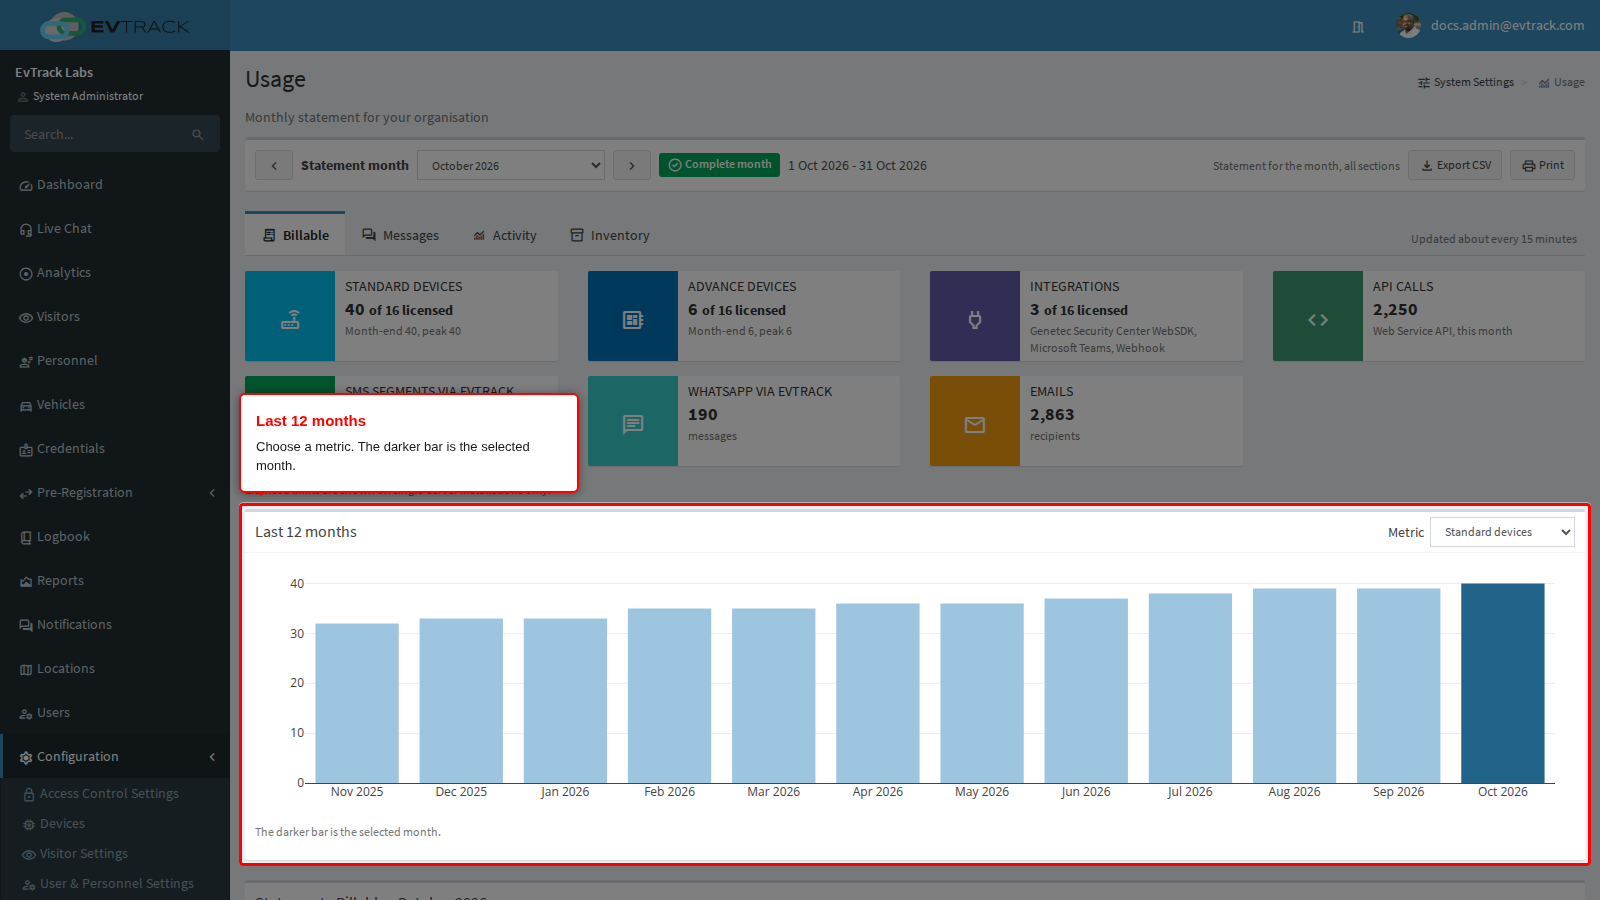
Last 12 months charts one metric over the year that ends with the selected month; pick the metric from the list next to the title. For devices, integrations, API keys and daily active users each bar is the month-end count (the count on the last day of the month with data); for everything else it is the month’s total. The darker bar is the selected month, and a month with no data has no bar.
The Statement lists each metric with This month, Last month, the Change (the difference and the percentage) and Peak / month-end. For devices, integrations, API keys and daily active users the month figure is the count on the last day of the month and the peak is the highest daily count; for everything else it is the month’s total and the peak is the busiest day. A dash means there is no data for that month, which is not the same as zero.
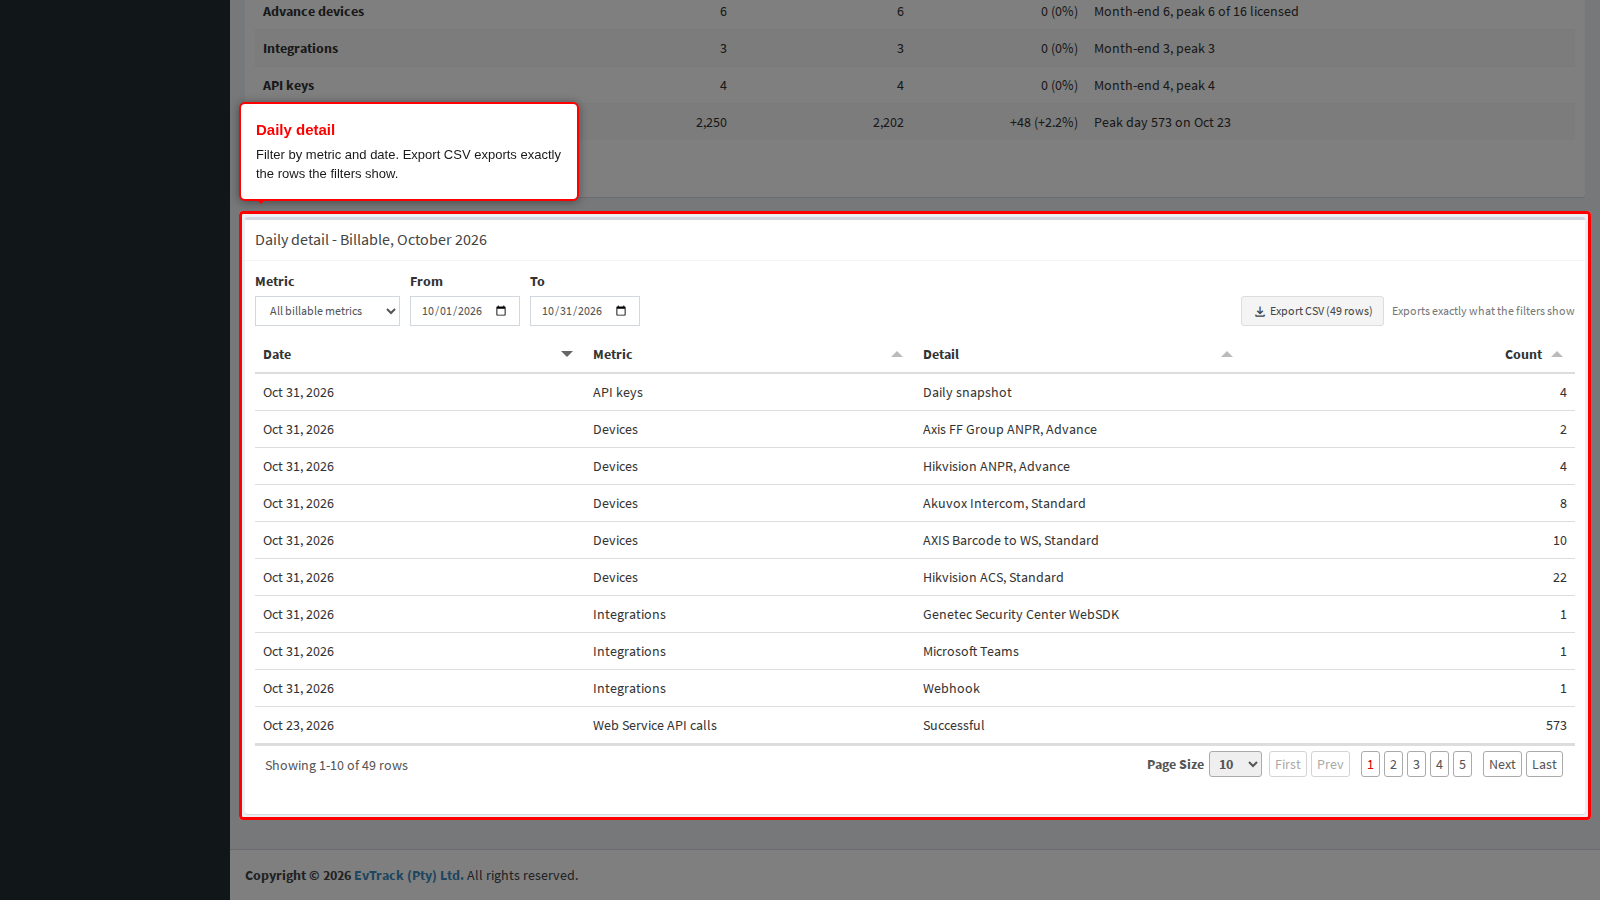
Daily detail lists the figures day by day. Filter it by Metric and by a From / To date within the month, sort it by any column, and page through it. Export CSV shows how many rows the filters select and downloads exactly those rows.
Messages
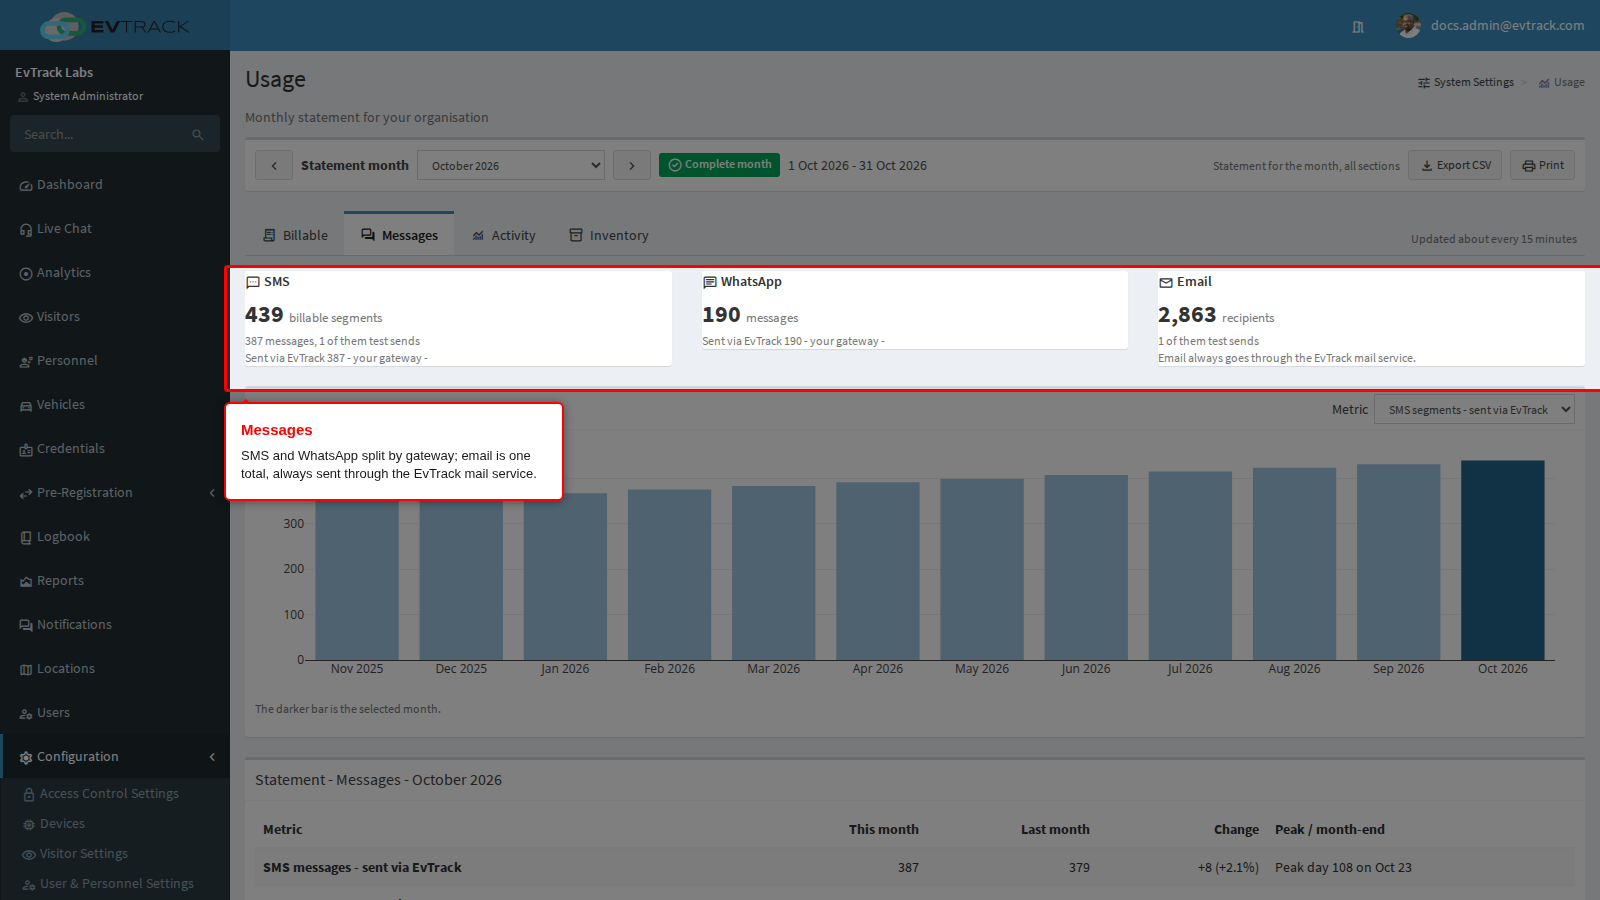
SMS and WhatsApp show the month’s total, with Sent via EvTrack (the platform’s gateway) and Sent via your gateway (your own SMS or WhatsApp account) side by side. SMS are counted in billable segments as well as messages. Email shows one total, counted per recipient: email always goes through the EvTrack mail service, so it has no gateway split. Test messages sent from the settings pages are billable and are included in the totals; the statement lists them separately as well.
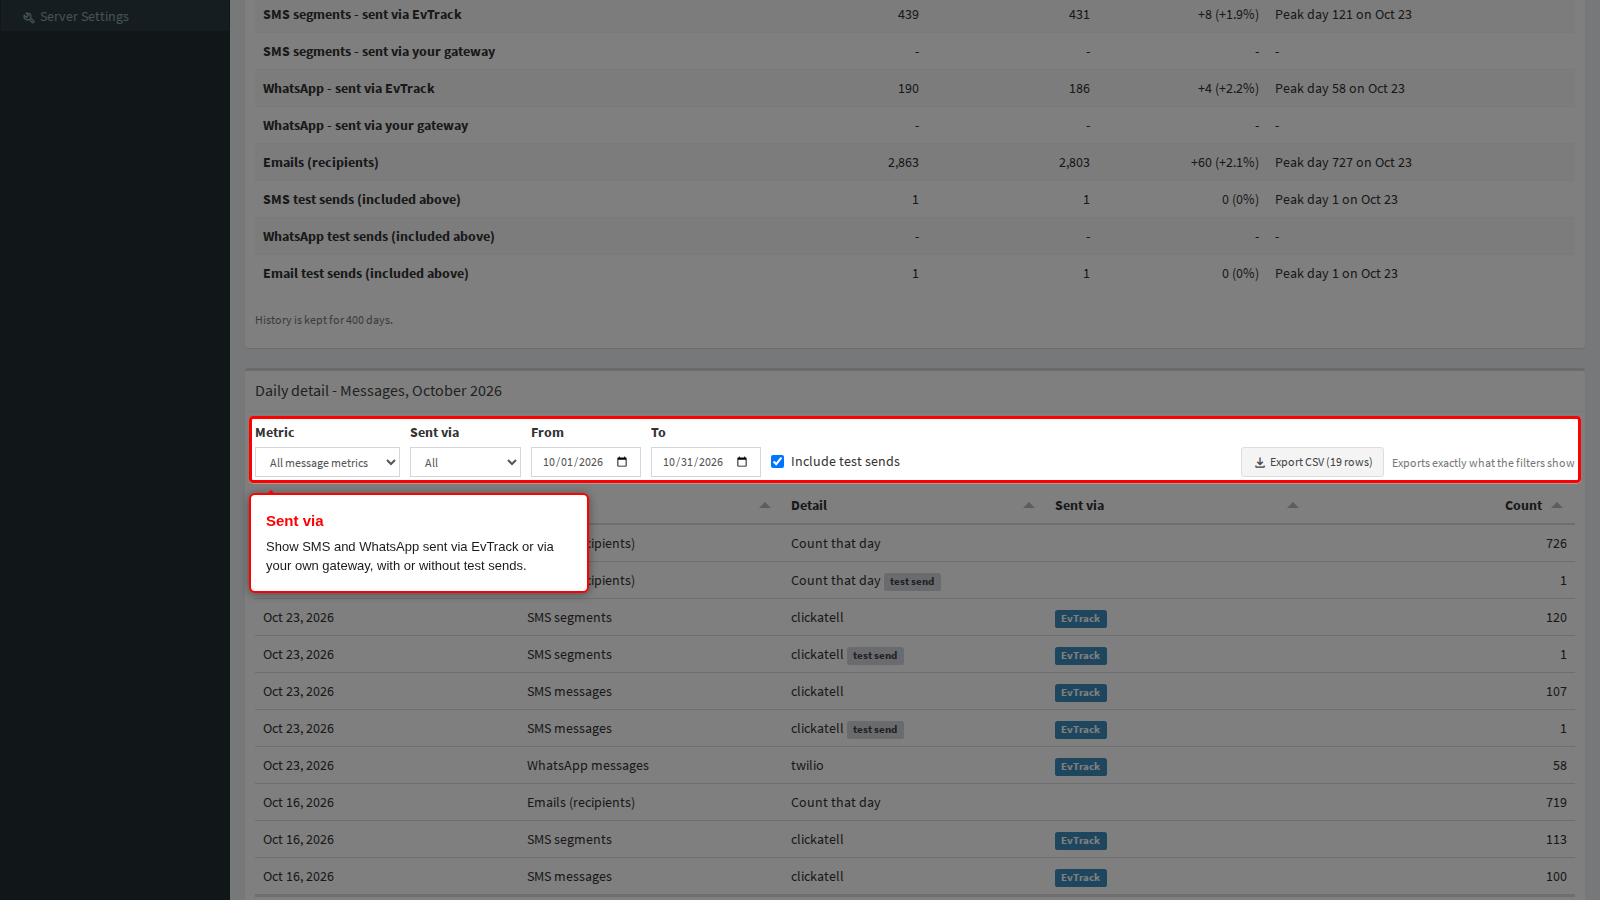
The Messages Daily detail adds a Sent via filter for SMS and WhatsApp and an Include test sends switch. Email rows have no gateway, so they appear only when Sent via is All.
Activity
The tiles at the top show the month’s check-ins, registrations, approvals and invites sent, each compared with last month. The statement breaks registrations down by method (Kiosk, Web, App, Pre-registration, Guard, Video Concierge and API), approvals into approved, declined and expired, and access events into granted and denied, and adds watchlist matches, logins and the daily active users (the number of different users who logged in on a day; the month figure is the last day’s count and the peak the busiest day).
Inventory
Devices by type shows, for each device type and licence tier, how many devices are enabled and disabled at the end of the month, with the peak and month-end of the enabled ones. Only enabled devices count towards the statement. Integrations by type and API keys show the same for integrations and Web Service API keys.
See also: System Settings for the other system-wide settings, and Web Service API for the API keys counted here.